
Quality of the municipal service and
satisfaction of the citizens of Piura 2021
Calidad del servicio municipal y
satisfacción de los ciudadanos de Piura 2021
Qualidade do serviço municipal e
satisfação dos cidadãos de Piura 2021
Edson Johan Caballero Marreros
Universidad
César Vallejo, Perú
ecaballeroma11@ucvvirtual.edu.pe
Carlos A. Choquehuanca Saldarriaga
Universidad Nacional Mayor de San
Marcos, Perú
cchoquehuancas@unmsm.edu.pe
Sara H. Gonzales Agama
Universidad Nacional Autónoma de
Tayacaja Daniel Hernández Morillo, Perú
saragonzalesagama@unat.edu.pe
Alberto Valenzuela Muñoz
Universidad Nacional Autónoma de
Tayacaja Daniel Hernández Morillo, Perú
albertovm5050@gmail.com
ABSTRACT
The objective of
the research has been to determine the relationship between the quality of the
municipal service and the satisfaction of the citizens of Piura 2021.
To meet this
objective, we collected data using the survey technique and, as an instrument,
the questionnaire, which we applied to a random sample of 384 citizens.
Once the data
was collected, we created a database using SPSS Version 25, from which we
described the variables (descriptive statistics) and the corresponding
hypothesis tests (inferential statistics).
The main
conclusion we have reached, with the investigation, has been that there is a
significant relationship between the quality of the municipal service and the
satisfaction of the citizens of Piura 2021.
Keywords: Service quality,
satisfaction.
RESUMEN
El objetivo de la investigación
ha sido determinar la relación que existe entre la calidad del servicio
municipal y la satisfacción de los ciudadanos de Piura 2021.
Para cumplir con dicho objetivo,
recogimos los datos utilizando la técnica de la encuesta y, como instrumento,
el cuestionario, que aplicamos a una muestra aleatoria de 384 ciudadanos.
Una vez recogidos los datos,
elaboramos una base de datos utilizando el SPSS Versión 25, a partir de la cual
hicimos la descripción de las variables (la estadística descriptiva) y las
pruebas de hipótesis correspondientes (la estadística inferencial).
La principal conclusión a que
hemos arribado, con la investigación, ha sido que existe una relación
significativa entre la calidad del servicio municipal y la satisfacción de los
ciudadanos de Piura 2021.
Palabras
clave: Calidad del servicio, satisfacción.
RESUMO
O objetivo da pesquisa foi
determinar a relação entre a qualidade do serviço municipal e a satisfação dos
cidadãos de Piura 2021.
Para cumprir este objetivo,
recolhemos dados utilizando a técnica de inquérito e, como instrumento, o
questionário, que aplicámos a uma amostra aleatória de 384 cidadãos.
Uma vez coletados os dados,
criamos um banco de dados no SPSS Versão 25, a partir do qual descrevemos as
variáveis (estatística descritiva) e os correspondentes testes de
hipóteses (estatística inferencial).
A principal conclusão a que
chegamos, com a investigação, foi que existe uma relação significativa entre a
qualidade do serviço municipal e a satisfação dos munícipes de Piura 2021.
Palavras-chave: Qualidade
do serviço, satisfação.
INTRODUCTION
In general,
institutions must make efficient and effective use of their resources. When it
comes to private institutions, logically, the owners try to satisfy their clients
and obtain the maximum return on their investments. In any case, if you are not
successful in your undertaking, the losses are the individual or the group that
owns the company. On the other hand, when it comes to public institutions
(central government, regional governments, local governments, etc.), it is
about offering the best service, to achieve maximum citizen satisfaction. In
this case, if public management is not successful, resources that belong to all
citizens will have been wasted.
Regarding the
quality of service, there are various definitions. The Royal Spanish Academy
(2014) maintains that quality is the "Property or set of properties
inherent to something, which allow its value to be judged".
Ishikawa (1986)
states that quality is intended to "develop, design, manufacture and
maintain the product (...) that is the most economical, the most useful and
always satisfactory for the consumer" (p. 40).
Sanabria et al.
(2014) consider quality "as a process that goes through and affects the
entire organization, from its smallest unit to the one that is directly related
to the total functioning of the system, multidimensionalizing the value chain
and the actors involved" (p. 205).
Duque (2005)
considers that quality, from the client's perspective, "is the perceived
quality and its evaluation depends on the specific characteristics of the
service, the clients and the context in which they operate" (p. 76).
Matsumoto (2014)
defines service quality as an "evaluation process where the consumer
compares their expectations against their perceptions. That is to say, the
measurement of quality is carried out through the difference between the
service that the client expects, and the one that he receives from the company
(pp. 184-185).
Villalba (2013)
maintains that, in a synthesis of the different perspectives, the authors agree
that the measurement of service quality can be seen in principle as "a
subjective construct that owes its essence to the way consumers perceive said
quality, so that the best way to measure it is through the perception emitted
by the final judge, who is the consumer” (pp. 69-70).
Regarding
satisfaction, there are also different definitions. Zeithaml and Bitner (2002)
argue that customer satisfaction is "the evaluation made by the customer
regarding a product or service, in terms of whether it met their needs and
expectations" (p. 103).
Douglas (2007)
states that customer satisfaction "is a term to measure in a specific
transaction, if the perception regarding the service received by the customer
meets or exceeds their expectations" (p. 329).
Kotler (2002)
considers that customer satisfaction is a function of "perceived
performance and expectations, if performance matches expectations, the customer
is satisfied" (p. 21).
Dutka (1994)
argues that satisfaction is the expectations and demands of the client and
determines to what extent a company and its main competitors are successful in
satisfying those expectations and demands” (p. 9).
Vavra (2003)
maintains that satisfaction is a subjective judgment of the client who
experiences when evaluating what is perceived of his previous experience of our
product or service and of the organization with the true performance of our
product or service and the contact with our organization.
Regarding the
relationship between the quality of service and satisfaction, many
investigations have been carried out.
Garay (2020), in
his thesis, set out to "Evaluate citizen satisfaction and the quality of
the service of the Social Concentration Directorate of the municipality of
Monterrey during the 2015-2018 administration" (p. 14), in a correlational
investigation , with a non-experimental and cross-sectional design, using the
survey technique and, as an instrument, the questionnaire that was applied to
186 citizens, reaching the conclusion that "the satisfaction of the
citizens and the quality of the service of the Directorate of Social
Concertation, it was observed that the citizens who made complaints are in the
middle ground” (p. 113).
Bernal et al.
(2017), in their article, set out to "analyze service quality, user
satisfaction and the relationship that exists between these two study
variables" (p. 37), in a correlational, non-experimental and
non-experimental design research. cross-sectional, using the survey technique
and, as an instrument, the questionnaire that was applied to 876 users of eight
public hospitals in the state of Tamaulipas, Mexico, reaching the conclusion
that "there is a good perception by the beneficiaries, statistically their
level of satisfaction will be favored, as shown by this research where both
variables studied were rated with trends whose responses mainly range between
good and excellent” (p. 45).
Mosquera (2020),
in his article, set out to "analyze the information on the quality of
service in the care provided to the user in the Ministry of Labor, Regional
Guayaquil", in a correlational investigation, of non-experimental design
and of cross-sectional, using the survey technique and, as an instrument, the
questionnaire that was applied to 136 users, concluding that 90.44% feel
satisfied with the care they received, which demonstrated the importance of
officials As an element to measure satisfaction, however, there were aspects
such as the waiting time and the knowledge of the officials, which were
considered of good quality.
Figueroa (2020),
in his thesis, set out to "Determine the incidence of Service Quality of
the MAC Center on user satisfaction, Ventanilla, 2019" (p. 6), in a
correlational investigation, with a non-experimental design and cut
cross-sectional, using the survey technique and, as an instrument, the
questionnaire that was applied to 62 users, concluding that there has been a
significant relationship between the quality of the MAC Center service and user
satisfaction in Ventanilla, 2019.
Santos, (2019),
in his thesis, set out to "Determine the relationship that exists between
the quality of the service and the satisfaction of the user under the
institutional political perception in the administration of justice of
Huancayo-2018" (p. 44), in a correlational research, non-experimental
design and cross-sectional, using the survey technique and, as an instrument,
the questionnaire that was applied to 250 defendants, reaching the conclusion
that "there is a high significant relationship between the quality of the
service and the user satisfaction under institutional political perception in
the justice administration of Huancayo-2018” (p. 140).
Velásquez
(2019), in his thesis, set out to "determine the impact of service quality
on outpatient user satisfaction in a Network of the Ministry of Health, in
2019" (p. 7), in a correlational investigation, with a non-experimental
and cross-sectional design, using the survey technique and, as an instrument,
the questionnaire that was applied to 242 users, concluding that there is a
significant relationship between service quality and user satisfaction.
Our article
raised the following general problem: What is the relationship between the
quality of the municipal service and the satisfaction of the citizens of Piura
2021? From which the following specific problems were derived: 1. What
relationship exists between the tangibility of the municipal service and the
satisfaction of the citizens of Piura 2021? 2. What relationship exists between
the reliability of the municipal service and the satisfaction of the citizens
of Piura 2021? 3. What relationship exists between the response capacity of the
municipal service and the satisfaction of the citizens of Piura 2021?
In accordance
with these research problems, the article raised the following objectives.
General objective: Determine the relationship between the quality of the
municipal service and the satisfaction of the citizens of Piura 2021. Specific
objectives: 1. Determine the relationship between the tangibility of the
municipal service and the satisfaction of the citizens of Piura 2021. 2.
Determine the relationship between the reliability of the municipal service and
the satisfaction of the citizens of Piura 2021. 3. Determine the relationship
between the responsiveness of the municipal service and the satisfaction of the
citizens of Piura 2021.
And in response
to the formulated research problems, we proposed the following hypotheses.
General hypothesis: There is a significant relationship between the quality of
the municipal service and the satisfaction of the citizens of Piura 2021.
Specific hypotheses: 1. There is a significant relationship between the
tangibility of the municipal service and the satisfaction of the citizens of
Piura 2021. 2. There is a significant relationship between the reliability of
the municipal service and the satisfaction of the citizens of Piura 2021. 3.
There is a significant relationship between the responsiveness of the municipal
service and the satisfaction of the citizens of Piura 2021.
METHOD
The research is
of a correlational type, with a non-experimental and cross-sectional design.
Utilizó el método estadístico que
consiste en recopilar datos (en este caso utilizando la encuesta y, como
instrumento, el cuestionario), organizar los datos (a través de tablas),
presentar los datos (en este caso, a través de gráficos de barras), describir
los datos (utilizando frecuencias absolutas, relativas y acumuladas) y realizar
las pruebas de hipótesis (en este caso utilizando el test chi cuadrado).
It used the
statistical method that consists of collecting data (in this case using the
survey and, as an instrument, the questionnaire), organizing the data (through
tables), presenting the data (in this case, through bar graphs) , describe the
data (using absolute, relative and cumulative frequencies) and perform the
hypothesis tests (in this case using the chi square test).
The sample size
was obtained using the statistical formula for large populations, which is as
follows.
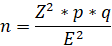
Where: n is the
sample size for large populations; Z is the value of the abscissa in the
standardized normal, p is the probability of hitting, q is the probability of
not hitting and E is the allowed error. With a significance level of 5%, a
maximum variance (which is equivalent to p = q = 0.5) and an allowed error of
5%, a value for n = 384 was obtained.
To prepare the
questionnaire, each of the variables was disaggregated into three dimensions;
each dimension was measured with three indicators and each indicator with three
questions, so that each questionnaire had a total of 27 questions. The people
surveyed were adults, half of whom were men and half women.
To measure the
reliability of the instrument, Cronbach's alpha was used, whose value reached
0.99 and its validation was done through the judgment of three experts, doctors
with experience and knowledge in this type of research.
With the data
obtained by applying the questionnaire, a database was created using the SPSS
software, which allowed us to obtain the descriptive and inferential results of
the research.
RESULTADOS
Descriptive
results on the quality of the service
Table 1
Presents the answers of the respondents on the tangibility of the
service provided by the Municipality of Piura.
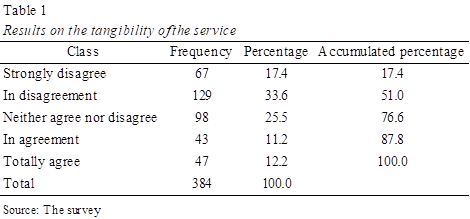
Said table shows
that the majority of those surveyed (33.6%) disagree with the tangibility of
the service provided by the Municipality of Piura; 25.5% neither agree nor
disagree; 17.4% completely agree; 12.2% strongly agree and 11.2% agree, as
illustrated in figure 1.
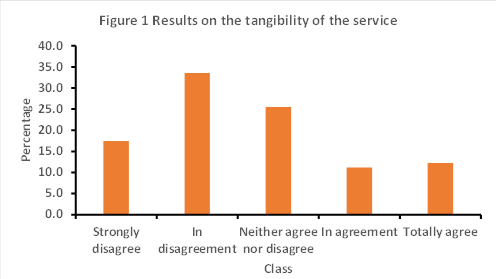
Table 2
Presents the responses of those surveyed on the reliability of the
service provided by the Municipality of Piura.
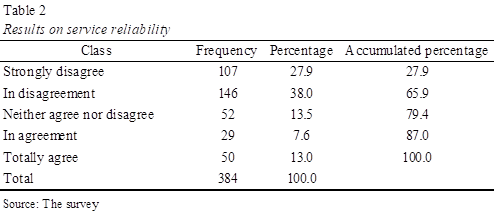
Said table shows that the majority of those surveyed (38.0%)
disagree with the reliability of the service provided by the Municipality of
Piura; 27.9% strongly disagree; 13.5% neither agree nor disagree; 13.0%
strongly agree and 7.6% agree, as illustrated in figure 2.
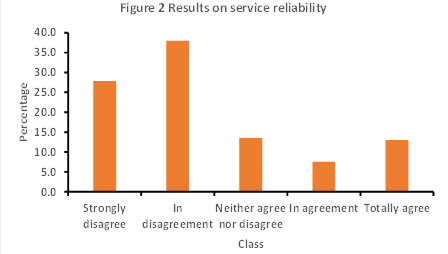
Table 3
Presents the responses of those surveyed on the response capacity of
the service provided by the Municipality of Piura.
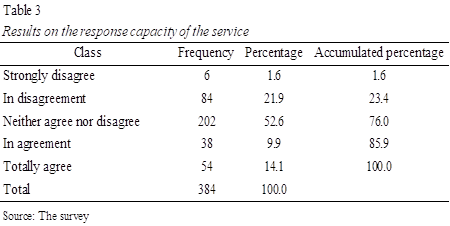
Said table shows that the majority of those surveyed (52.6%) neither
agree nor disagree with the response capacity of the service provided by the
Municipality of Piura; 21.9% disagree; 14.1% strongly agree; 9.9% agree and
1.6% strongly disagree, as illustrated in figure 3.
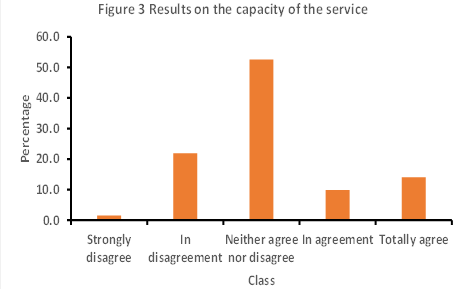
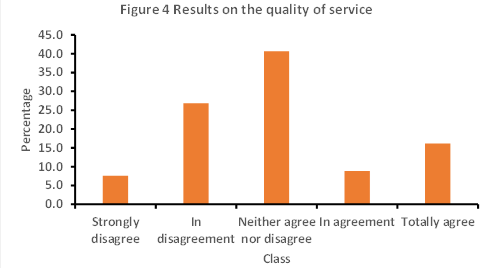
Table 4
Presents the responses of those surveyed on the quality of the
service provided by the Municipality of Piura.
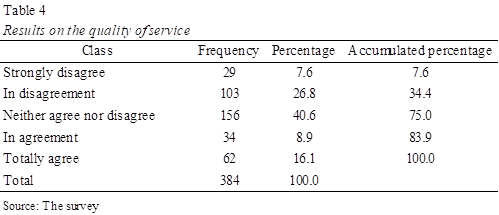
Said table shows that the majority of those surveyed (40.6%) neither
agree nor disagree with the quality of the service provided by the Municipality
of Piura; 26.8% disagree; 16.1% totally agree; 8.9% agree and 7.6% strongly
disagree, as illustrated in figure 4.
Descriptive results on citizen satisfaction
Table 5
Presents the responses of those surveyed on the satisfaction of
citizens with the service provided by the Municipality of Piura.
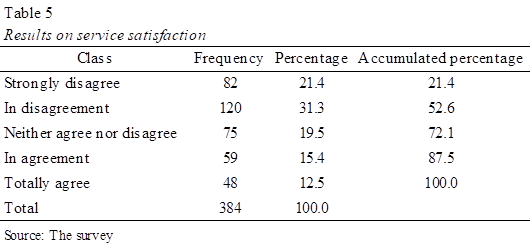
This table shows that the majority of respondents (31.3%) disagree
that the service provided by the Municipality of Piura is satisfactory; 21.4%
strongly disagree; 19.5% neither agree nor disagree; 15.4% agree and 12.5%
strongly agree, as illustrated in figure 5.
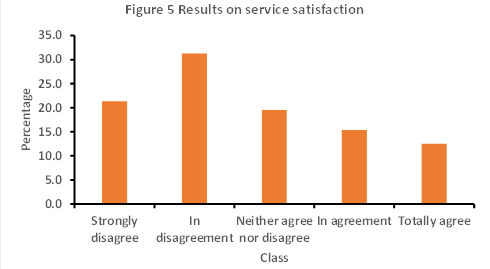
Table 6
Presents the responses of those surveyed on the satisfaction of
citizens with the performance of the authorities of the Municipality of Piura.
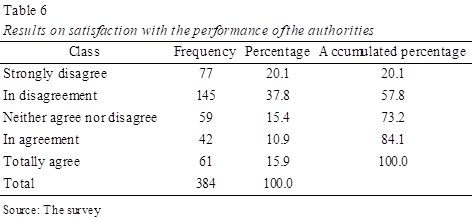
Said table shows that the majority of those surveyed (37.8%)
disagree with the performance of the authorities of the Municipality of Piura;
20.1% strongly disagree; 15.9% totally agree; 15.4% neither agree nor disagree
and 10.9% agree, as illustrated in figure 6.
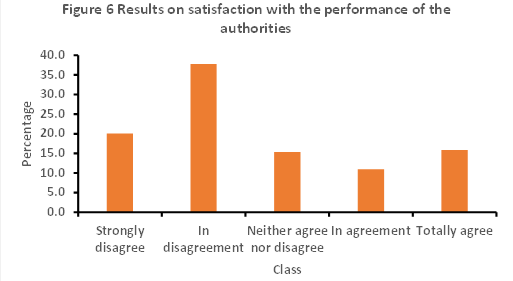
Table 7
Presents the
answers of those surveyed about the performance of the workers of the
Municipality of Piura.
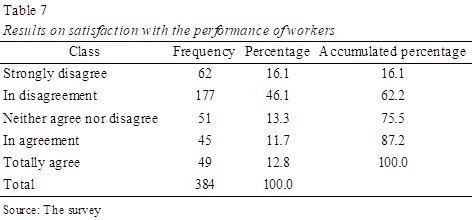
Said table shows that the majority of those surveyed (46.1%) do not
agree with the performance of the workers who provide services in the
Municipality of Piura; 16.1% strongly disagree; 13.3% neither agree nor disagree;
12.8% strongly agree and 11.7% agree, as illustrated in figure 7.
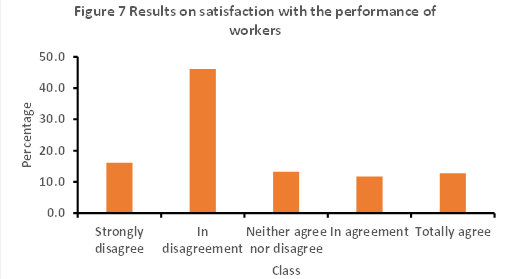
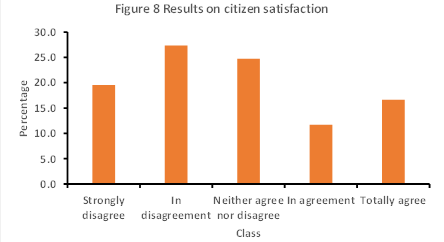
Table 8
Presents the responses of those surveyed on the satisfaction of
citizens with the service provided by the Municipality of Piura.
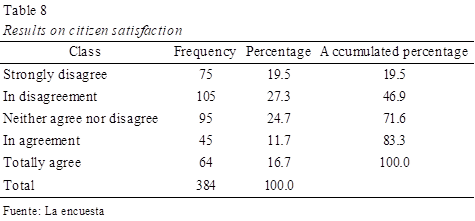
Said table shows that the majority of those surveyed (27.3%) are not
satisfied with the service provided by the Municipality of Piura; 24.7% neither
agree nor disagree; 19.5% strongly disagree; 16.7% strongly agree and 11.7%
agree, as illustrated in figure 8.
Inferential results
To test the hypothesis, we have used the chi-square test, taking
into account the following criteria for accepting or rejecting the null
hypothesis:
If the p value is greater than the level of significance
established, then the null hypothesis (H0) is accepted and the alternative
hypothesis (H1) is rejected.
If the p value is less than the level of significance established,
then the null hypothesis (H0) is rejected and the alternative hypothesis (H1)
is accepted.
In the investigation we have used a significance level of 5% (α
= 0.05).
Regarding the first specific hypothesis, the hypothesis to be tested
were the following:
H1: Existe una
relación significativa entre la tangibilidad del servicio municipal y la
satisfacción de los ciudadanos de Piura 2021.
H1: There
is a significant relationship between the tangibility of the municipal service
and the satisfaction of the citizens of Piura 2021.
From the database, the SPSS Version 25 software, we have obtained
the cross table between the tangibility and the satisfaction of the citizens of
Piura, which is shown in table 9.
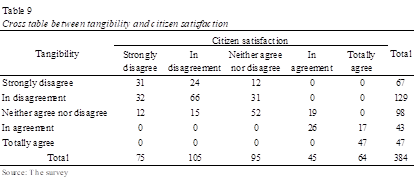
Using the data in table 9, SPSS Version 25 software has applied the
chi-square test, the results of which are shown in table 10.
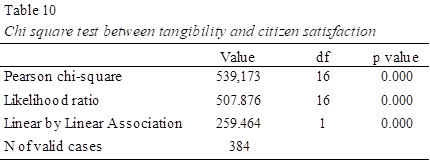
According to the established criteria and the results shown in table
10, we have that:
p value = 0.000 < = 0.05
Therefore, we reject the null hypothesis and accept the alternative
hypothesis.
Regarding the second specific hypothesis, the hypothesis to be
tested were the following:
H0: There
is no significant relationship between the reliability of the municipal service
and the satisfaction of the citizens of Piura 2021.
H1: There
is a significant relationship between the reliability of the municipal service
and the satisfaction of the citizens of Piura 2021.
From the database and, applying the SPSS Version 25 software, we
have obtained the cross table between the reliability and the satisfaction of
the citizens of Piura, which is shown in table 11.
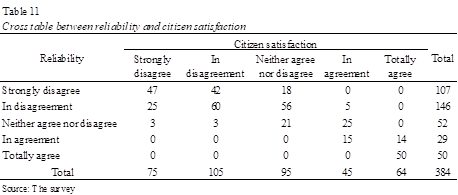
Using the data in table 11, SPSS Version 25 software has applied the
chi-square test, the results of which are shown in table 12.
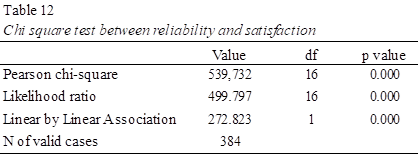
According to the established criteria and the results shown in table
12, we have that:
p valor = 0.000 < a = 0.05
Therefore, we reject the null hypothesis and accept the alternative
hypothesis.
Regarding the third specific hypothesis, the hypothesis to be tested
were the following:
H0: There
is no significant relationship between the response capacity of the municipal
service and the satisfaction of the citizens of Piura 2021.
H1: There
is a significant relationship between the response capacity of the municipal
service and the satisfaction of the citizens of Piura 2021.
From the database and, applying the SPSS Version 25 software, we
have obtained the cross table between the response capacity and the
satisfaction of the citizens of Piura, which is shown in table 13.
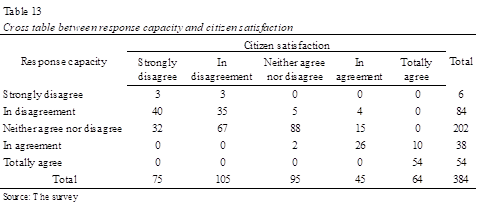
Using the data in table 13, SPSS Version 25 software has applied the
chi-square test, the results of which are shown in table 14.
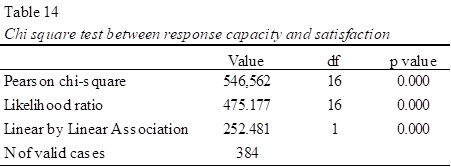
According to the established criteria and the results shown in table
14, we have that:
p valor = 0.000 < a = 0.05
Therefore, we
reject the null hypothesis and accept the alternative hypothesis.
Regarding the
general hypothesis, the hypothesis to be tested were the following:
H0: There
is no significant relationship between the quality of the municipal service and
the satisfaction of the citizens of Piura 2021.
H1: There
is a significant relationship between the quality of the municipal service and
the satisfaction of the citizens of Piura 2021.
From the database
and, applying the SPSS Version 25 software, we have obtained the cross table
between the quality of the service and the satisfaction of the citizens of
Piura, which is shown in table 15.
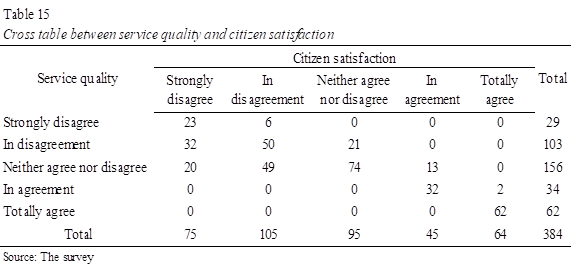
Using the data in
table 15, SPSS Version 25 software has applied the chi-square test, the results
of which are shown in table 16.
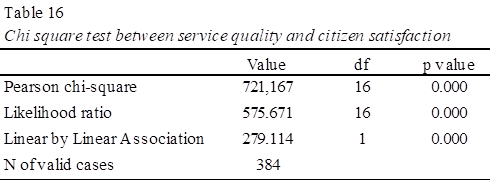
According to the
established criteria and the results shown in table 16, we have that: p valor =
0.000 < = 0.05
Therefore, we
reject the null hypothesis and accept the alternative hypothesis
DISCUSSION
AND CONCLUSIONS
In the first
place we must indicate that the results obtained in the investigation are
congruent with the conclusions reached by the national and international
antecedents that we have glossed, in the sense that the quality of the service
is not independent of the satisfaction of the users, in this case the citizens
of the city of Piura, that is, in other words, that they have a significant
relationship.
Second,
according to the research results, we can conclude that:
1.
There is a significant relationship between the
tangibility and the satisfaction of the citizens of the city of Piura.
2.
There is a significant relationship between
reliability and satisfaction of the citizens of the city of Piura.
3.
There is a significant relationship between the
response capacity and the satisfaction of the citizens of the city of Piura.
4.
There is a significant relationship between the
quality of the service and the satisfaction of the citizens of the city of
Piura.
In fact, there
is a relationship because citizens' perception of quality tends to be as low as
their satisfaction.
REFERENCIAS BIBLIOGRÁFICAS
[1] Bernal,
I., Pedraza, A., Lavín, J., & Monforte, G. (2017). Service
quality and users’ satisfaction assessment in the health context in Mexico. Evaluación
de la calidad del servicio y la satisfacción de los usuarios en el contexto
sanitario en México. Cuadernos de Administración: Universidad del Valle: Vol.
33 N° 57: January - April 2017.
http://www.scielo.org.co/pdf/cuadm/v33n57/0120-4645-cuadm-33-57-00036.pdf
[2]
Douglas, H. K. (2007). Principios de marketing y sus mejores
prácticas. (3ª ed.). Editorial Thomson Learning.
[3] Duque,
E. J. (2005). Revisión del concepto de calidad del servicio y sus modelos de
medición. INNOVAR. Revista de Ciencias Administrativas y Sociales, vol. 15,
núm. 25, enero-junio, 2005, pp. 64- 80 Universidad Nacional de Colombia Bogotá,
Colombia. http://www.redalyc.org/articulo.oa?id=81802505
[4]
Dutka, A. (1994). Manual de American Marketing Association para
la satisfacción del cliente. NTC Business Books.
[5] Figueroa,
S. L. (2020). Calidad del servicio del Centro de Mejor Atención al Ciudadano y
su incidencia en la satisfacción del usuario, Ventanilla 2019 [Tesis doctoral,
Universidad César Vallejo].
https://repositorio.ucv.edu.pe/handle/20.500.12692/45665
[6] Garay,
D. (2020). Evaluación de la satisfacción de los ciudadanos y la calidad del
servicio de la dirección de concertación social del Municipio de Monterrey en
el periodo 2015-2018 [Tesis doctoral, Universidad Autónoma de Nuevo León].
http://eprints.uanl.mx/19620/1/1080314235.pdf
[7] Ishikawa,
K. (1986). ¿Qué es el control total de calidad?: La modalidad japonesa.
Editorial Norma.
https://books.google.com.pe/books?id=MWGOXKteTQwC&pg=PR7&source=gbs_selected_pages&cad=2#v=onepage&q&f=false
[8]
Kotler, P. (2002). Dirección de marketing conceptos esenciales. Editorial Pearson Educacional.
[9] Matsumoto,
R. (2014). Desarrollo del Modelo Servqual para la medición de la calidad del
servicio en la empresa de publicidad Ayuda Experto. PERSPECTIVAS, núm. 34,
octubre, 2014, pp. 181-209 Universidad Católica Boliviana San Pablo Cochabamba,
Bolivia. http://www.redalyc.org/articulo.oa?id=425941264005
[10] Mosquera, Y. (2020).
Análisis de la calidad de servicio en atención del usuario en el Ministerio de
Trabajo Regional Guayaquil- Ecuador. Empresa, Investigación y Pensamiento
Crítico, 32(6 (4)), 55-65. http://repositorio.unemi.edu.ec/bitstream/123456789/5231/1/ARTICULO%20CIENENTIFICO-%20YEANYNE%20MOSQUERA%20TUCUNANGO.pdf
[11] Real
Academia Española (2014). Diccionario de la lengua española. (23ª
ed.). RAE.
[12] Sanabria, P. E., Romero, V.
del C., & Flórez, C. I. (2014). El concepto de calidad en las organizaciones:
una aproximación desde la complejidad. Universidad & Empresa. vol. 16, núm.
27, julio-diciembre, 2014, pp. 165-213 Universidad del Rosario Bogotá,
Colombia. http://www.redalyc.org/articulo.oa?id=187241606007
[13] Santos, R. (2019). Calidad
del servicio y satisfacción del usuario bajo la percepción política
institucional en la Administración de Justicia de Huancayo - 2018 [Tesis
doctoral, Universidad César Vallejo].
https://repositorio.ucv.edu.pe/handle/20.500.12692/38416
[14] Vavra,
T. G. (2003). Cómo medir la satisfacción del cliente según la ISO 9001:2000. (2ª ed.). FC Editorial. Fundación Confemetal.
[15] Velásquez, E. del C. (2019).
Calidad del servicio en la satisfacción del usuario de consulta externa en una
Red del Ministerio Salud, en el año 2019 [Tesis doctoral, Universidad César
Vallejo]. https://repositorio.ucv.edu.pe/handle/20.500.12692/40912
[16] Zeithaml,
V.A., & Bitner, M. J. (2002). Marketing de Servicios un enfoque de
integración del cliente a la empresa. (2ª ed.). Editorial Mc
Graw Hill; Interamericana.